ANNUAL REPORT TO SHAREHOLDERS
Published on March 30, 2004
Exhibit 13.1
To the Shareholders of
Commonwealth Biotechnologies, Inc.
This past year was a year of firsts for CBI; a record number of contracts, the first year in which signed contract volume totaled more than a record $7 million, the first year in which the Company was awarded a CODIS data base contract, and the first year in which CBI showed a net profit (albeit only a modest profit) for two consecutive quarters. CBI has been cash positive and EBITDA positive for the past two years.
In 2003, CBI initiated discussions on several new business initiatives, one of which has just recently come to fruition. These initiatives can be directly attributed to the hard work and persistence of its revitalized marketing activities, which were made possible by a private placement completed in 2002. Hence, CBI announced execution of a unique Broad Teaming Agreement with Dynport Vaccine Co., LLC, Frederick, MD, under which CBI and Dynport will co-venture wherever appropriate to compete for new monies in bio-defense and vaccine development.
Dynport is a joint venture of DynCorp, a CSC company, and Porton International Inc whose charge is to ensure the safety of U.S. operating forces through the advanced development and manufacture of biodefense related products, in particular, vaccines directed towards bio-threat agents. DVC provides an integrated approach for the advanced development of specific vaccines and other products to protect our nation against the threat of bio-warfare agents. This development effort includes process refinement, cGMP production, non-clinical testing, clinical evaluation and successful submission of Biologics License Applications to the Food and Drug Administration (FDA). Dynport and CBI have a long-standing and extremely successful relationship wherein CBI has already provided Dynport with key research, development, and production capabilities in support of Dynports many bio-defense related programs. Dynport and CBI are also currently teamed on no less than six major contract proposals valued at more than $30 million which are pending review at the various sponsoring agencies. In the past year alone, revenues realized by CBI, in pursuit of Dynport contracts has exceeded $ 1.2 million. In signing the Agreement, CBI and Dynport acknowledged their complementary expertise and capabilities in the performance of life sciences contract research programs as they relate to on-going bio-defense initiatives. At present, Dynport is focused in several areas, including development of vaccines directed against Anthrax, Botulinum, Plague, Staphylococcal Enterotoxin, Tularemia, Smallpox, and Venezuelan Equine Encephalitis.
But perhaps the most exciting aspect of 2003 was the dramatic improvement in the Companys fiscal position. At year-end, the Company reported a modest profit for the fourth quarter, which was the second consecutive quarter of profitability. For the fourth quarter, in terms of net earnings, the Company showed a positive swing of about $400,000, compared to the same period in 2003. For the year 2003, the Company recorded a loss of approximately $81,000 on $5.1 million in gross sales, compared to a loss in 2002 of $626,000 on $4.4 million in gross sales. Of equal importance, the
Company realized positive cash flows from operations of approximately $240,000 and was EBITDA positive for the second consecutive year. The 2003 EBITDA calculation of $776,412 is shown below:
2003 EBITDA Calculation
| Net Loss |
$ | (80,601 | ) | |
| Add: Interest and Amortization |
258,249 | |||
| Depreciation |
598,764 | |||
| Taxes |
| |||
| EBITDA |
$ | 776,412 | ||
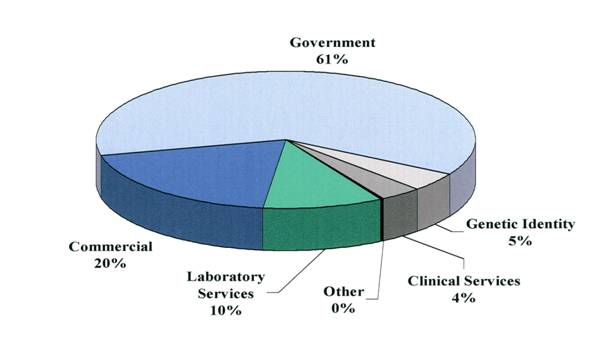
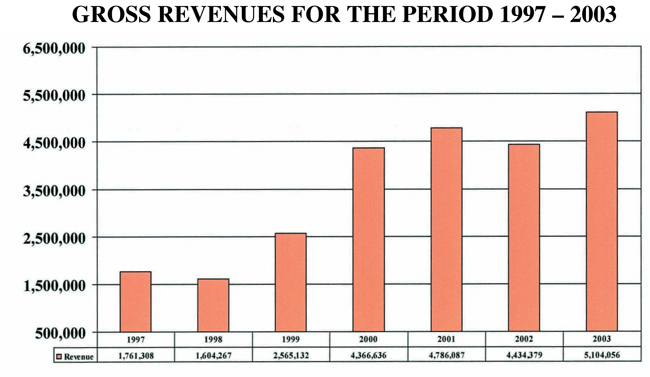
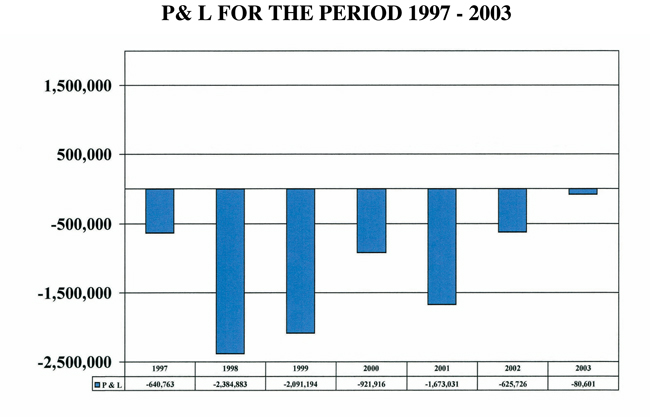
CBI continues to show positive growth in gross revenues while simultaneously shrinking its net operating loss. Over the last 6 years, since its IPO in 1997, CBIs overall gross revenues have increased nearly 200% and its net operating losses have decreased nearly 90%. Interestingly, while the majority of our clients are in the private sector, the bulk of our revenues are currently derived from government sources. We hope to equalize this distribution of revenues by increasing the number and magnitude of contract with commercial clients. Graphically, these trends are shown in the figures below. While there is still progress to be made, we look forward to an even better year in 2004!
REVENUE DISTRIBUTION - 2003
2
| * | Revenue in 2001 includes a one-time license fee payment of $ 400,000 |
3
Thank You for Your Continued Support
CBI is doing a better job of communicating progress to its shareholders. Through press releases and 8-K announcements, CBI has informed its shareholders of new contract signings and significant milestones in the Companys operations. The Companys progress in all areas this past year has resulted in increasing the value of the Companys stock, but management still believes the Company is undervalued. In 2004, we will continue to explore all possible ways of enhancing shareholder value.
CBIs employees continue to increase individual and collective productivity. We have signed a record number of contracts without significantly increasing staff. Our ability to do this directly contributes to the bottom line by helping to hold a tight line on expenses. The fact that we are asked to team with industry partners in pursuit of high dollar contract proposals is directly related to the professionalism and expertise of our employees. Thanks to one and all.
You are cordially invited to attend CBIs 2004 Annual Meeting of Shareholders on May 14, 2004 at 11:00 a.m. at the Companys facility.
With best regards,
| Richard J. Freer, Ph.D. |
Robert B. Harris, Ph.D. |
|
| Chairman of the Board, COO |
President, CEO |
|
| Thomas R. Reynolds |
James H. Brennan |
|
| Executive Vice-President, |
Controller |
|
| Science and Technology |
||
CBI welcomes your calls and inquiries.
| Phone: |
800-735-9224 |
|
| Fax: |
804-648-2642 |
|
| E-Mail: |
info@cbi-biotech.com |
|
| Web: |
www.cbi-biotech.com |
|
| Address: |
601 Biotech Drive |
|
| Richmond, VA 23235 |
4
Stockholder Matters
Market for Common Equity
The Company completed its initial public offering on October 28, 1997 at a price per share of $6.00. Since that time, the common stock has traded on the NASDAQ SmallCap Market (NASDAQ). The following table sets forth the range of high and low sales price per share of common stock for 2003 and 2002. These market quotations reflect inter-dealer prices, without retail mark-up, mark-down, or commission and may not necessarily represent actual transactions.
| Period |
High Stock Price |
Low Stock Price |
||||
| 1st Quarter, 2003 |
$ | 2.52 | $ | .54 | ||
| 2nd Quarter, 2003 |
$ | 2.26 | $ | 1.01 | ||
| 3rd Quarter, 2003 |
$ | 4.21 | $ | 1.44 | ||
| 4th Quarter, 2003 |
$ | 4.08 | $ | 2.60 | ||
| Period |
High Stock Price |
Low Stock Price |
||||
| 1st Quarter, 2002 |
$ | 2.97 | $ | 1.65 | ||
| 2nd Quarter, 2002 |
$ | 1.99 | $ | 1.23 | ||
| 3rd Quarter, 2002 |
$ | 1.40 | $ | .57 | ||
| 4th Quarter, 2002 |
$ | 1.15 | $ | .37 | ||
On March 15, 2004, the last reported sales price for a share of the Companys Common Stock on NASDAQ was $6.53. As of March 14, 2004 there were 41 holders of record of the Companys Common stock and 1,667 beneficial holders.
The Company has not paid any cash dividends on its Common Stock. The Company intends to retain its earnings to finance the growth and development of its business and does not expect to declare or pay dividends in the foreseeable future. The declaration of dividends is within the discretion of the Company. However, the Companys ability to pay dividends may be constrained by certain provisions of its industrial revenue bond financing.
5
Selected Financial Data
Set forth below is selected financial data with respect to the Company for the years ended December 31, 2003, December 31, 2002, and December 31, 2001, which has been derived from the audited financial statements of the Company. The selected financial data set forth below should be read in conjunction with Managements Discussion and Analysis of Financial Conditions and Results of Operation.
|
For the years Ended December 31, |
||||||||||||
|
2003 |
2002 |
2001 |
||||||||||
| Operational Data: |
||||||||||||
| Revenues: |
$ | 5,104,056 | $ | 4,434,379 | $ | 4,786,087 | ||||||
| Net Loss |
$ | (80,601 | ) | $ | (625,726 | ) | $ | (1,673,031 | ) | |||
| Basic and diluted loss per common and common equivalent share |
$ | (0.03 | ) | $ | (0.29 | ) | $ | (0.81 | ) | |||
| Weighted average common shares outstanding |
2,486,699 | 2,194,029 | 2,076,164 | |||||||||
| Balance Sheet Data: |
||||||||||||
| Total Current Assets |
$ | 1,155,839 | $ | 838,687 | $ | 817,046 | ||||||
| Total Assets |
$ | 7,581,213 | $ | 7,823,073 | $ | 8,348,718 | ||||||
| Total Current Liabilities |
$ | 579,920 | $ | 751,986 | $ | 803,638 | ||||||
| Total Liabilities |
$ | 4,209,920 | $ | 4,481,986 | $ | 4,693,949 | ||||||
| Total Stockholders equity |
$ | 3,371,293 | $ | 3,341,087 | $ | 3,654,769 | ||||||
MANAGEMENTS DISCUSSION AND ANALYSIS OF FINANCIAL CONDITION AND RESULTS OF OPERATIONS.
The following should be read in conjunction with Selected Financial Data and the Companys Audited Financial Statements and Notes thereto included herein.
Overview
The Companys revenues are derived principally from providing macromolecular synthetic and analytical services to researchers in the biotechnology industry or who are engaged in life sciences research in government or academic labs throughout the world. Development of innovative technologies for biotechnology requires sophisticated laboratory techniques and the Company provides these services to customers on a contract basis. The Companys customers consist of private companies, academic institutions and government agencies, all of which use biological processes to develop products for health care, agricultural, and other purposes.
The Company generally derives revenue from two types of customers: those who require a discrete set of services (lab services), and those who contract with the Company on an extended basis for performance of a variety of services (commercial contracts, and government contracts). The Company continues to grow its defense contract business and is now actively engaged in all areas in bio defense related work. The Company acts as both prime and subcontractor for bio defense related work.
6
More often than not, the Companys customers provide repeat business to the Company. The Company views commercial, drug development, and government contracts as the more important sources of revenue. The Company has continued to focus its efforts on identifying these customers. These contracts generally range from a few months to more than a year. Revenues are generally recognized as services are rendered or as products are delivered. In addition, revenue is also recognized with performance-based installments payable over the contract as milestones are achieved.
The Company also derives revenues from genetic identity and clinical services. There has been a dramatic and constant increase in the number of private paternity cases implemented at the Company and in the number of molecular diagnostic assays performed. The Company designed and implemented molecular diagnostic assays for the presence of DNA attributable to the various human herpes viruses. This platform technology is being used to serve individual patients across the country and in support of an on-going clinical study with a new anti-viral therapeutic. The Company has grown its molecular diagnostic platform in several other critical areas and its services are being used in support of still other on-going clinical trials and in support of fundamental research and development programs for its clients.
Results of Operations
Year Ended December 31, 2003 Compared to Year Ended December 31, 2002.
Revenues
Gross revenues increased by $669,677 or 15.1% from $4,434,379 during the year ended December 31, 2002 (2002) to $5,104,056 during the year ended December 31,2003 (2003).
The Company experiences fluctuations in all revenue categories. Continuation of existing projects, or engagement for future projects is usually dependent upon the customers satisfaction with the scientific results provided in initial phases of the scientific program. Continuation of existing projects or engagement of future projects also often depends upon factors beyond the Companys control, such as the timing of product development and commercialization programs of the Companys customers. The Company is unable to predict for more than a few months in advance the volume and dollar amount of future projects. The combined impact of commencement and termination of research contracts from several large customers and unpredictable fluctuations in revenue for laboratory services can result in very large fluctuations in financial performance.
Revenues from lab services decreased by $227,209 or 30.2% from $753,337 during 2002 to $526,128 during 2003. This decrease is primarily due to an the effort of the Company to move away from short term work and begin to focus on long-term commercial and government contracts. The Company continues to view lab services as a potential revenue source. However, the Company views commercial and government projects as the more important source of revenue and has continued to focus its efforts on identifying long-term contractual customers.
7
Revenues realized from various commercial contracts decreased by $494,183 or 33.1%, from $1,491,863 during 2002 to $997,680 during 2003. This decrease is primarily due to (1) work being completed with three major clients and (2) increased focus in government contracts awarded to the Company. Of the $997,680 in commercial contracts, three major clients represented 37.3%, 14.3% and 11.6%, respectively, of the revenue earned during 2003. The Company will continue to work with these three clients in 2004.
Revenues realized from various government contracts increased by $1,228,204 or 63.8%, from $1,925,486 during 2002 to $3,153,690 during 2003. This increase was primarily due to a new contract that began in early February. Total revenues for this contract were $1,154,278. It is anticipated that the Company will continue to do work in 2004 under this contract. Revenue from all of the other government contracts is comparable with last year. Revenues recognized from the Illinois Institute of Technology Research Institute (IITRI) subcontract were $696,381 during 2003. Of the $696,381, $218,569 represents revenue from the fifth year of the contract, which was awarded in September 2003. Additional revenues to be recognized for the remainder of the fourth year of the contract in 2004 are $465,469. Revenues recognized from the second government sponsor for 2002 amounted to $719,471. This project is expected to be completed in April 2004 with additional revenue of approximately $78,700 to be received under to the project for the remainder of 2004.
Revenues recognized from a third government sponsor for 2003 amounted to $799,452. This project was completed in January 2004. The Company anticipates additional contract revenue from this entity in 2004.
Revenues realized from various genetic testing increased by $96,141 or 71.6%, from $134,281 during 2002 to $230,422 during 2003. This increase is a direct result of the continuation of two major contracts to perform genetic identity analysis.
Revenues realized from other genotyping services increased by $112,138 or 140.6%, from $79,766 during 2002 to $191,904 during 2003. This increase is a direct result of the continuation of two major contracts to perform genetic identity analysis.
8
Cost of Services
Cost of services consists primarily of materials, labor, subcontractor costs and overhead. The cost of services increased by $157,368 or 4.7% from $3,371,131 during 2002 to $3,528,499 during 2003. The cost of services as a percentage of revenue was 69.1% and 75.9% during 2003 and 2002, respectively. This percentage decrease was primarily due to additional expenditures in labor and materials (see below.)
Direct labor costs increased by $57,448, or 5.3%, from $1,084,103 during 2002 to $1,141,551 during 2003.
The costs for direct materials increased by $110,308, or 13.4%, from $825,897 during 2002, to $936,205 during 2003. This increase is directly attributable to the growth in net revenue of the Company.
Overhead cost consists of indirect labor, depreciation, freight charges, repairs and miscellaneous supplies not directly related to a particular project. Total overhead costs decreased by $20,007 or 1.4%, from $1,418,701 during 2002 to $1,438,708 during 2003. This decrease is primarily due to reduced or eliminated production related expenditures,
Sales, General and Administrative
Sales, general and administrative expenses (SGA) consist primarily of compensation and related costs for administrative, marketing, facility expenditures, professional fees, consulting, taxes, and depreciation. Total SGA costs increased by $16,930, or 1.2%, from $1,403,949 during 2002 to $1,420,879 during 2003. As a percentage of revenue, these costs were 27.8% and 31.7% during 2003 and 2002, respectively.
Total compensation and benefits increased by $15,439 or 2.9% from $523,839 during 2002 to $539,278 during 2003. Costs in compensation remained relatively flat as compared to last year.
Professional fees decreased by $83,851 or 26.4% from $317,139 during 2002 to $233,288 during 2003. This decrease is primarily due to a rate reduction in legal fees and one time consulting costs paid in 2002 that did not occur in 2003. Taxes and Licenses decreased by $28,564 or 28.3% from $100,872 during 2002 to $72,308 during 2003. This decrease is primarily due to a rate reduction in personal property taxes paid to the county. Office expenses increased by $6,832 or 11.4%, from $59,918 during 2002 to $66,750 during 2003. This increase is primarily due to additional office supplies.
Marketing costs increased by $114,061 or 95.9%, from $118,889 during 2002 to $232,950 during 2003. This increase was primarily due to the addition of a Senior Vice President for Strategic Business Development with his focus on building the revenue stream of the Company.
Other Income (Expenses)
Other income increased by $14,590, or 174.1% from $8,380 during 2002 to $22,970 during 2003. This increase is due to a one-time payment from the insurance company for downed equipment due to a power outage.
9
Interest costs incurred by the Company during the 2003 and 2002 periods included (1) interest paid to financial institutions for loans made to the Company; (2) interest paid for the Companys IRBs; and (3) amortization of costs incurred as a consequence of the completion of the Companys IRB financing. Interest expense decreased by $35,156 or 12.4% from $293,405 during 2002 to $258,249 during 2003.
Results of Operations
Year Ended December 31, 2002 Compared to Year Ended December 31, 2001.
Revenues
Gross revenues decreased by $351,708 or 7.3% from $4,786,087 during the year ended December 31, 2001 (2001) to $4,434,379 during the year ended December 31,2002 (2002).
On April 30, 2001, the Company signed a patent license agreement with Applied Biosystems Group of PE Corporation, New York. This license agreement granted Applied Biosystems a non-exclusive, worldwide, perpetual, non-assignable license under the Patent. This enabled Applied Biosystems to research, develop, make, have made, import, market, use, sell, have sold, offer to sale, distribute, have distributed and otherwise exploit products and services and to pass on to end user customers of Applied Biosystems or its distributors the right to use such product and services. The Company received licensing fees of $400,000 in the second quarter of 2001, of which $200,000 was received in cash and the remaining $200,000 in product and service credits. This impacted favorably on 2001s financial statements. Excluding this one-time license fee, gross revenues increased by $48,292 or 1.1% from $4,386,087 during the 2001 Period to $4,434,379 during the 2002 Period.
10
Revenues from lab services increased by $93,604 or 14.2% from $659,733 during 2001 to $753,337 during 2002. Over the course of the year, the Company had continued to see growth in one-time orders.
Revenues realized from various commercial contracts decreased by $293,867 or 16.5%, from $1,785,730 during 2001 to $1,491,863 during 2002. The decrease was primarily due to work being completed with four major clients. Of the $1,491,863 in commercial contracts, two major clients represented 20.7% and 12.8%, respectively, of the revenue earned during 2002.
Revenues realized from various government contracts increased by $357,371 or 22.8%, from $1,568,115 during 2001 to $1,925,486 during 2002. This increase was primarily due to work on three government projects during 2002. Revenues recognized from the IITRI subcontract were $720,096 during 2002. Of the $720,096, $94,741 represents revenue from the fourth year of the contract, which was awarded in September 2002. Additional revenues to be recognized for the remainder of the fourth year of the contract in 2003 are $392,383. Revenues recognized from the second government sponsor for 2002 amounted to $719,471. This project was completed in February 2003.
Revenues recognized from a third government sponsor for 2002 amounted to $288,043. This project was completed in January 2003. Additional funds of approximately $400,000 have been added to perform additional work in 2003.
Revenues realized from various genetic testing decreased by $78,931 or 37.0%, from $213,212 during 2001 to $134,281 during 2002. This decrease is a direct result of the cancellation of a major contract by a customer who chose to continue the work internally and the cancellation of our marketing efforts due to the cost cutting policy issued by management.
In 2001, under license from a third party, the Company implemented rapid and novel techniques for analysis of patient samples for the presence of residual DNA attributable to the various human herpes viruses.
Revenues realized from this and other genotyping services decreased by $45,280 or 36.2%, from $125,046 during 2001 to $79,766 during 2002. In order to attract new patient work, the Company offers discounts to large clinical practices. In addition, the Company must pay royalties on the technology used.
Revenues realized from license fees in 2002 were $4,000 as compared to $402,000 in 2001. As mentioned below, this decrease is a direct result of the one-time license fee paid to the Company.
11
On April 30, 2001 the Company signed a patent license agreement (U.S. Patent No. 6,110,683 entitled Automated DNA Sequencer Loading Dye Which Contains A Lane Tracking Aid issued August 29, 2000) with Applied Biosystems Group, an Applera Corporation, Foster City, CA. The Company received licensing fees of $400,000 of which $200,000 was received in cash in the second quarter and the remaining $200,000 in product and service credits. These credits were utilized in June and the equipment is fully operational.
In November 2001, the Company signed a license agreement for the in vitro use of HepArrest with MediRox AB, Linkoping, Sweden. This non-exclusive license limits MediRox to the use of HepArrest in its own proprietary diagnostic instruments and obligates MediRox to purchase HepArrest from the Company. MediRox will pay the Company a $50,000 license fee and is buying HepArrest exclusively from CBI. Depending on how fast MediRox can grow its in vitro diagnostic market sales of HepArrest can become a contributing revenue source for the Company.
Cost of Services
Cost of services consists primarily of materials, labor, subcontractor costs and overhead. The cost of services excluding research and development costs, decreased by $710,701 or 17.4% from $4,081,832 during 2001 to $3,371,131 during 2002. The cost of services as a percentage of revenue was 76.0% and 85.3% during 2002 and 2001, respectively. This percentage decrease was primarily due to reduction in costs in direct materials and expenditures in subcontractor costs (see below.)
Direct Labor costs decreased by $55,768, or 4.9%, from $1,139,871 during 2001 to $1,084,103 during 2002. This decrease reflects the cost cutting measures taken by management that included reduced staffing through layoffs and attrition.
The costs for direct materials decreased by $121,089, or 12.9%, from $947,706 during 2001, to $825,897 during 2002. This decrease is directly attributable to more labor-intensive projects obtained by the Company.
Subcontractor costs as of 2001 were $102,907. These costs incurred were from subcontractors in the new drug development activity that was placed in operation in 2001. There were virtually no subcontract costs in 2002.
Overhead cost consists of indirect labor, depreciation, freight charges, repairs and miscellaneous supplies not directly related to a particular project. Total overhead costs decreased by $444,486 or 23.9%, from $1,863,187 during 2001 to $1,418,701 during 2002. This decrease is primarily due to the following: 1) reduction of salaries that were charged to indirect labor, 2) management reduced staffing through layoffs and attrition and reduced or eliminated production related expenditures, 3) reduced maintenance costs on equipment, and 4) elimination of amortization costs associated with the purchase of contracts in Drug Development.
12
Research and development costs within the Company fall into two general categories: grant-related research and development and in-house research and development. These categories are distinguished by those performed in support of government grant-sponsored programs, and those performed in the absence of such grants which are funded from working capital. Total expenditures to perform grant-related research activities decreased by $9,034, or 63.0%, from $14,348 during 2001 to $5,314 during 2002. This decrease is primarily due to the Company redirecting its focus on long-term commercial contracts. There were no expenditures made by the Company for in-house research activities. This decision is primarily attributable to the reallocation of all personnel from internal R&D efforts to focus on its core business in contract research.
Sales, General and Administrative
Sales, general and administrative expenses (SGA) consist primarily of compensation and related costs for administrative, marketing and sales personnel, facility expenditures, professional fees, consulting, taxes, and depreciation. Total SGA costs decreased by $613,429, or 30.4%, from $2,017,378 during 2001 to $1,403,949 during 2002. As a percentage of revenue, these costs were 31.7% and 42.2% during 2002 and 2001, respectively.
Total compensation and benefits decreased by $80,766 or 13.4% from $604,606 during 2001 to $523,839 during 2002. This decrease is attributable to the reduction in administrative staff due to the cost cutting measures implemented by management in 2001.
Facility costs decreased by $41,581 or 41.1% from $101,259 during 2001 to $59,678 during 2002. This decrease is primarily due to the elimination of rent paid for the offices of the drug development division. Depreciation expense decreased by $45,873 or 31.6%, from $145,231 during 2001 to $99,358 during 2002. This decrease is primarily due to the write-off of obsolete equipment in 2001. Taxes and Licenses decreased by $24,650 or 19.6% from $125,522 during 2001 to $100,872 during 2002. This decrease is primarily due to a rate reduction in business taxes, sales taxes and personnel property taxes paid to the state and county in Virginia. Office expenses decreased by $37,712 or 38.6%, from $97,630 during 2001 to $59,918 during 2002. This decrease is primarily due to across the board cuts in all items associated with conducting business in the office. Other costs increased by $105,973 or 59.7% from $177,626 during 2001 to $71,653 during 2002. This decrease is primarily due to the difference in bad debt write-offs in 2001 that did not happen in 2002.
Marketing costs decreased by $215,616 or 64.5%, from $334,505 during 2001 to $118,889 during 2002. Based on managements decision to control expenditures, there was virtually no advertising done during the 2002 Period. Whereas during the 2001 Period, the Company opted to increase its marketing exposure throughout the marketplace with major increases in advertising and public relations.
13
Other Income (Expense)
Interest income decreased by $68,034, or 89.0% from $76,414 during 2001 to $8,380 during 2002. This decrease is due to the lack of investment income.
Interest costs incurred by the Company during the 2002 and 2001 Periods included (1) interest paid to financial institutions for loans made to the Company; (2) interest paid for the Companys IRBs; and (3) amortization of costs incurred as a consequence of the completion of the Companys IRB financing. Interest expense increased by $10,281 or 3.6% from $283,124 during 2001 to $293,405 during 2002.
Liquidity and Capital Resources
The 2003 Period reflected cash provided by from operating activities of $248,625, as compared to $242,912 during the 2002 Period. This was primarily due to the decrease in net loss, offset by an increase in accounts receivable of 307,418.
The 2003 Period reflected a use of cash from financing activities of $174,153, as compared to $57,395 during the 2002 Period. The 2002 Period included net proceeds from issuance of stock of $248,000 versus $2,000 in the current year.
Net working capital as of December 31, 2003 and December 31, 2002 was $575,919 and $86,701, respectively. This increase is a direct result of increase in cash and accounts receivables as well as a reduction in outstanding payables.
In the fourth quarter of 1999, the Company was awarded a five-year subcontract with the Illinois Institute of Technology Research Institute. The contract is valued at approximately $8.5 million. During the fourth Quarter in 2003, the fifth year of this contract was awarded amounting to $696,381 to the Company. In March 2004, the Company received approval of additional funding from the customer in the amount of $769,375 for a project that will be completed during the second quarter of 2004.
In September 2003, the Company received approval to begin working on a project from an existing client in the amount of $452,148. Since the inception of this project, the Company has recognized $22,579. Work on project will be done over a five-month period.
In March 2004, the Company received approximately $546,000 from the sale of ISOs. These ISOs were exercised both from management and employees of the Company. Therefore, the Company believes that the cash flow from operations is expected to be sufficient to cover operating expenses for the current fiscal year.
14
Critical Accounting Policies
A summary of the Companys accounting policies follows:
Estimates: The preparation of the financial statements requires management to make estimates and assumptions that affect the reported amounts of asset and liabilities and disclosure of contingent asset and liabilities at the date of the financial statements and the reported amounts of revenues and expenses during the period. Actual results could differ from those estimates.
Revenue Recognition: The Company recognizes revenue upon the completion of laboratory service projects, or upon the delivery and acceptance of biologically relevant materials that have been synthesized in accordance with project terms. Laboratory service projects are generally administered under fee for service contracts. Any revenues from research and development arrangements, including corporate contracts and research grants, are recognized pursuant to the terms of the related agreements as work is performed, or scientific milestones, if any are achieved. Amounts received in advance of the performance of services or acceptance of a milestone, are recorded as deferred revenue.
Accounts receivable: Accounts receivable are carried at original invoice amount less an estimate for doubtful receivables based on a review of all outstanding amounts on a monthly basis. Management determines the allowance for doubtful accounts by regularly evaluating individual customer receivables and considering a customers financial condition, credit history, and current economic conditions. Accounts receivable are written off when deemed uncollectible. Recoveries of accounts receivable previously written off are recorded when received.
CBI has met the SEC and NASDAQ Corporate Governance Rules.
As a consequence of the Sarbanes-Oxley Act, the NASDAQ imposed certain changes in the rules of corporate governance which are aimed at strengthening its listing standards. The Securities and Exchange Commission (SEC) approved the rules imposed by NASDAQ which include
| | Independent Directors. CBIs Board is composed of 4 independent and 3 employee directors. |
| | The Independent Directors serve on the three principal committees; Audit, Compensation and Nominations. |
| | The Independent Directors meet in executive session at each quarterly Board meeting. |
| | At least one Independent Director, Mr. Sam Sears, who serves on the Audit Committee, meets all of the requirements as defined by the SEC for being a financial expert. |
15
| | The Audit Committee reviews and approves all related-party transactions. CBI has adapted a formal Corporate Code of Conduct. Copies are available on request from Dr. Robert B. Harris, President and Chief Executive Officer, and on the Companys website at www.cbi-biotech.com. |
Forward Looking Statements
Management has included herein certain forward-looking statements within the meaning of Section 27A of the Securities Act of 1933, as amended, and Section 21E of the Securities Exchange Act of 1934, as amended. When used, statements that are not historical in nature, including the words anticipated, estimate, should, expect, believe, intend, and similar expressions are intended to identify forward-looking statements. Such statements are, by their nature, subject to certain risks and uncertainties.
Among the factors that could cause the actual results to differ materially from those projected are the following:
| | business conditions and the general economy, |
| | the development and implementation of the Companys long-term business goals, |
| | federal, state, and local regulatory environment, |
| | lack of demand for the Companys services, |
| | the ability of the Companys customers to perform services similar to those offered by the Company in-house, |
| | potential cost containment by the Companys customers resulting in fewer research and development projects, |
| | the Companys ability to receive accreditation to provide various services, including, but not limited to paternity testing, and |
| | the Companys ability to hire and retain highly skilled employees, |
Other risks, uncertainties, and factors that could cause actual results to differ materially from those projected are detailed from time to time in reports filed by the company with the Securities and Exchange Commission, including Forms 8-K, 10-QSB, and 10-KSB.
16
ITEM 3. CONTROLS AND PROCEDURES
The Companys Chief Executive Officer and Controller (principal executive officer and principal financial officer, respectively) have concluded, based on their evaluation as of December 31, 2003, that the design and operation of the Companys disclosure controls and procedures (as defined in Rule 13a-15(e) under the Securities Exchange Act of 1934, as amended (Exchange Act)) are effective to ensure that information required to be disclosed by the Company in the reports filed or submitted by the Company under the Exchange Act is accumulated, recorded, processed, summarized and reported to management, including the Companys principal executive officer and principal financial officer, as appropriate to allow timely decisions regarding whether or not disclosure is required.
During the quarter ended December 31, 2003, there were no changes in the Companys internal controls over financial reporting (as defined in Rule 13a-15(f) under the Exchange Act) that have materially affected, or are reasonably likely to materially affect the Companys internal controls over financial reporting.
17
Commonwealth Biotechnologies, Inc.
Financial Statements
Years Ended December 31, 2003 and 2002
18
Commonwealth Biotechnologies, Inc.
Contents
| Report of Independent Certified Public Accountants |
20 21 | |
| Financial Statements |
||
| Balance Sheets |
22 -23 | |
| Statements of Operations |
24 | |
| Statements of Changes in Stockholders Equity |
25 | |
| Statements of Cash Flows |
26 | |
| Summary of Significant Accounting Policies |
27 31 | |
| Notes to Financial Statements |
32 37 | |
19
Report of Independent Certified Public Accountants
Board of Directors and Stockholders
Commonwealth Biotechnologies, Inc.
Richmond, Virginia
We have audited the accompanying balance sheet of Commonwealth Biotechnologies, Inc. as of December 31, 2003 and the related statement of operations, changes in stockholders equity, and cash flows for the year then ended. These financial statements are the responsibility of the Companys management. Our responsibility is to express an opinion on these financial statements based on our audit.
We conducted our audit in accordance with auditing standards generally accepted in the United States of America. Those standards require that we plan and perform our audit to obtain reasonable assurance about whether the financial statements are free of material misstatement. An audit includes examining, on a test basis, evidence supporting the amounts and disclosures in the financial statements. An audit also includes assessing the accounting principles used and significant estimates made by management, as well as evaluating the overall financial statement presentation. We believe that our audit provides a reasonable basis for our opinion.
In our opinion, the financial statements referred to above present fairly, in all material respects, the financial position of Commonwealth Biotechnologies, Inc. at December 31, 2003, and the results of its operations and its cash flows for the year then ended, in conformity with accounting principles generally accepted in the United States of America.
/s/ BDO SEIDMAN, LLP
January 23, 2004
20
McGladrey & Pullen
Certified Public Accountants
Independent Auditors Report
To the Board of Directors and Stockholders
Commonwealth Biotechnologies, Inc.
Richmond, Virginia
We have audited the accompanying balance sheet of Commonwealth Biotechnologies, Inc. as of December 31, 2002 and the related statements of operations, changes in stockholders equity, and cash flows for the year then ended. These financial statements are the responsibility of the Companys management. Our responsibility is to express an opinion on these financial statements based on our audit.
We conducted our audit in accordance with auditing standards generally accepted in the United States of America. Those standards require that we plan and perform the audit to obtain reasonable assurance about whether the financial statements are free of material misstatement. An audit includes examining, on a test basis, evidence supporting the amounts and disclosures in the financial statements. An audit also includes assessing the accounting principles used and significant estimates made by management, as well as evaluating the overall financial statement presentation. We believe that our audit provides a reasonable basis for our opinion.
In our opinion, the financial statements referred to above present fairly, in all material respects, the financial position of Commonwealth Biotechnologies, Inc. as of December 31, 2002, and the results of its operations and its cash flows for the year then ended, in conformity with accounting principles generally accepted in the United States of America.
The accompanying 2002 financial statements have been prepared assuming the Company will continue as a going concern. The Companys significant operating losses and negative cash flows raise substantial doubt about its ability to continue as a going concern. The 2002 financial statements do not include any adjustments that might result from the outcome of this uncertainty.
/s/ McGladrey & Pullen, LLP
Richmond, Virginia
February 18, 2003
21
Commonwealth Biotechnologies, Inc.
Balance Sheets
| December 31, |
2003 |
2002 |
||||
| Assets |
||||||
| Current assets |
||||||
| Cash and cash equivalents |
$ | 294,922 | $ | 270,144 | ||
| Accounts receivable, net of allowance for doubtful accounts of approximately $71,000 and $69,000 (Note 6) |
799,981 | 492,563 | ||||
| Prepaid expenses and other current assets |
60,936 | 75,980 | ||||
| Total current assets |
1,155,839 | 838,687 | ||||
| Property and equipment, net (Notes 1 and 3) |
5,649,657 | 6,198,728 | ||||
| Other assets |
||||||
| Bond issuance costs, less accumulated amortization 2003 $62,137; 2002 $51,393 |
206,462 | 217,205 | ||||
| Restricted cash (Note 3) |
569,255 | 568,453 | ||||
| Total other assets |
775,717 | 785,658 | ||||
| $ | 7,581,213 | $ | 7,823,073 | |||
See accompanying summary of accounting policies and notes to financial statements.
22
Commonwealth Biotechnologies, Inc.
Balance Sheets
(continued)
| December 31, |
2003 |
2002 |
||||||
| Liabilities and Stockholders Equity |
||||||||
| Current liabilities |
||||||||
| Current maturities of long-term debt (Note 3) |
$ | 100,000 | $ | 160,311 | ||||
| Accounts payable and other current liabilities |
241,769 | 259,536 | ||||||
| Interest payable |
90,596 | 96,324 | ||||||
| Deferred compensation |
133,259 | 136,288 | ||||||
| Deferred revenue |
14,296 | 84,847 | ||||||
| Demand note payable (Note 2) |
| 14,680 | ||||||
| Total current liabilities |
579,920 | 751,986 | ||||||
| Long-term debt, less current maturities (Note 3) |
3,630,000 | 3,730,000 | ||||||
| Total liabilities |
4,209,920 | 4,481,986 | ||||||
| Commitments and contingencies (Notes 4 and 5) |
||||||||
| Stockholders equity |
||||||||
| Common stock, no par value, 10,000,000 shares authorized, 2003 2,534,928; 2002 2,433,779, shares issued and outstanding |
| | ||||||
| Additional paid-in capital |
12,315,806 | 12,204,999 | ||||||
| Accumulated deficit |
(8,944,513 | ) | (8,863,912 | ) | ||||
| Total stockholders equity |
3,371,293 | 3,341,087 | ||||||
| $ | 7,581,213 | $ | 7,823,073 | |||||
See accompanying summary of accounting policies and notes to financial statements.
23
Commonwealth Biotechnologies, Inc.
Statements of Operations
| Year Ended December 31, |
2003 |
2002 |
||||||
| Revenues (Note 6) |
||||||||
| Government contracts |
$ | 3,153,690 | $ | 1,925,486 | ||||
| Commercial contracts |
997,680 | 1,491,863 | ||||||
| Laboratory services |
526,128 | 753,337 | ||||||
| Genetic identity |
230,422 | 134,281 | ||||||
| Clinical services |
191,904 | 79,766 | ||||||
| Other revenue |
4,232 | 49,646 | ||||||
| Total revenues |
5,104,056 | 4,434,379 | ||||||
| Cost of services |
||||||||
| Overhead |
1,438,708 | 1,418,701 | ||||||
| Direct labor |
1,141,551 | 1,084,103 | ||||||
| Direct materials |
936,205 | 825,897 | ||||||
| Other direct costs |
12,035 | 42,430 | ||||||
| Total cost of services |
3,528,499 | 3,371,131 | ||||||
| Gross profit |
1,575,557 | 1,063,248 | ||||||
| Selling, general and administrative |
1,420,879 | 1,403,949 | ||||||
| Operating income (loss) |
154,678 | (340,701 | ) | |||||
| Other income (expense) |
||||||||
| Interest expense |
(258,249 | ) | (293,405 | ) | ||||
| Other income |
22,970 | 8,380 | ||||||
| Total other income (expense) |
(235,279 | ) | (285,025 | ) | ||||
| Net loss |
$ | (80,601 | ) | $ | (625,726 | ) | ||
| Loss per common share, basic and diluted |
$ | (0.03 | ) | $ | (0.29 | ) | ||
See accompanying summary of accounting policies and notes to financial statements.
24
Commonwealth Biotechnologies, Inc.
Statements of Changes in Stockholders Equity
| Number of Shares Outstanding |
Additional Paid-in Capital |
Accumulated Deficit |
Total |
|||||||||||
| Balance, December 31, 2001 |
2,076,164 | $ | 11,892,955 | $ | (8,238,186 | ) | $ | 3,654,769 | ||||||
| Issuance of common stock |
357,615 | 366,500 | | 366,500 | ||||||||||
| Issuance costs |
| (54,456 | ) | | (54,456 | ) | ||||||||
| Net loss |
| | (625,726 | ) | (625,726 | ) | ||||||||
| Balance, December 31, 2002 |
2,433,779 | 12,204,999 | (8,863,912 | ) | 3,341,087 | |||||||||
| Issuance of common stock |
101,149 | 110,807 | | 110,807 | ||||||||||
| Net loss |
| | (80,601 | ) | (80,601 | ) | ||||||||
| Balance, December 31, 2003 |
2,534,928 | $ | 12,315,806 | $ | (8,944,513 | ) | $ | 3,371,293 | ||||||
See accompanying summary of accounting policies and notes to financial statements.
25
Commonwealth Biotechnologies, Inc.
Statements of Cash Flows
| Year Ended December 31, |
2003 |
2002 |
||||||
| Operating activities |
||||||||
| Net loss |
$ | (80,601 | ) | $ | (625,726 | ) | ||
| Adjustments to reconcile net loss to cash provided by (used in) operating activities |
||||||||
| Depreciation and amortization |
609,508 | 631,730 | ||||||
| Issuance of stock in lieu of board fees |
109,167 | 64,500 | ||||||
| Changes in assets and liabilities |
||||||||
| Accounts receivable |
(307,418 | ) | 138,726 | |||||
| Prepaid expenses |
15,045 | (6,374 | ) | |||||
| Accounts payable |
(26,525 | ) | (8,526 | ) | ||||
| Deferred revenue |
(70,551 | ) | 48,582 | |||||
| Cash provided by operating activities |
248,625 | 242,912 | ||||||
| Investing activities |
||||||||
| Purchases of property and equipment |
(49,694 | ) | (31,524 | ) | ||||
| Cash used in investing activities |
(49,694 | ) | (31,524 | ) | ||||
| Financing activities |
||||||||
| Increase in restricted cash |
(802 | ) | (52,920 | ) | ||||
| Principal payments on debt obligations, including capital lease obligations |
(174,991 | ) | (252,019 | ) | ||||
| Proceeds from issuance of common stock |
1,640 | 247,544 | ||||||
| Cash used in financing activities |
(174,153 | ) | (57,395 | ) | ||||
| Net increase in cash and cash equivalents |
24,778 | 153,993 | ||||||
| Cash and cash equivalents, beginning of year |
270,144 | 116,151 | ||||||
| Cash and cash equivalents, end of year |
$ | 294,922 | $ | 270,144 | ||||
| Supplemental Disclosure of Cash Flow Information |
||||||||
| Cash payments for interest |
$ | 247,505 | $ | 262,480 | ||||
See accompanying summary of accounting policies and notes to financial statements.
26
Commonwealth Biotechnologies, Inc.
Summary of Significant Accounting Policies
Nature of Business
Commonwealth Biotechnologies, Inc., (the Company), was formed on September 30, 1992, for the purpose of providing specialized analytical laboratory services for the life scientist. The Company provides basic research services in the general areas of protein/peptide and DNA/RNA chemistries. Such services include synthesis, sequence analysis, composition analysis, protein purification and biophysical characterization of biologically relevant materials. The Company also pursues its own research and development leading to intellectual properties.
Estimates
The preparation of financial statements requires management to make estimates and assumptions that affect the reported amounts of assets and liabilities and disclosure of contingent asset and liabilities at the date of the financial statements and the reported amounts of revenues and expenses during the period. Actual results could differ from those estimates.
Revenue Recognition
The Company recognizes revenue upon the completion of laboratory service projects, or upon the delivery and acceptance of biologically relevant materials that have been synthesized in accordance with project terms. Laboratory service projects are generally administered under fee-for-service contracts or purchase orders. Any revenues from research and development arrangements, including corporate contracts and research grants, are recognized pursuant to the terms of the related agreements as work is performed, or as scientific milestones, if any, are achieved. Amounts received in advance of the performance of services or acceptance of a milestone, are recorded as deferred revenue.
Long-Lived Assets
Long-lived assets, such as property, plant, and equipment, are evaluated for impairment when events or changes in circumstances indicate that the carrying amount of the asset may not be recoverable through the estimated undiscounted future cash flows from the use of those assets. When any such impairment exists, the related assets will be written down to fair value. No impairment losses have been recorded through December 31, 2003.
Cash and Cash Equivalents
The Company considers all highly liquid debt instruments purchased with an original maturity of three months or less to be cash equivalents. At times, the Company maintains cash balances in excess of FDIC insured amounts. As of December 31, 2003, the excess over the FDIC amount was $101,596.
Accounts Receivable
Accounts receivable are carried at original invoice amount less an estimate made for doubtful receivables based on a review of all outstanding amounts on a monthly basis. Management determines the allowance for doubtful accounts by regularly evaluating individual customer receivable and considering a customers financial condition, credit history, and current economic conditions. Accounts receivable are written off when deemed uncollectible. Recoveries of accounts receivable previously written off are recorded when received.
27
Commonwealth Biotechnologies, Inc.
Summary of Significant Accounting Policies
(continued)
Property and Equipment
Property and equipment are recorded at cost. Depreciation is computed principally by the straight-line method over the following estimated useful lives providing depreciation and amortization for financial reporting purposes. The cost of repairs and maintenance is expensed as incurred. The estimated useful lives of the assets are as follows:
|
Years |
||
| Buildings |
39.5 | |
| Laboratory and computer equipment |
3 10 | |
| Furniture and fixtures and office equipment |
7 | |
| Automobile |
5 |
Other Assets
Bond issuance costs consist of origination cost associated with the 2000 bond issue and are being amortized over twenty-five years using the straight-line method, which does not differ materially from the effective interest method. Amortization expense was $10,744 for the years ended December 31, 2003 and 2002.
Income Taxes
Deferred taxes are provided on an asset and liability method whereby deferred tax assets are recognized for deductible temporary differences and deferred tax liabilities are recognized for taxable temporary differences. Temporary differences are the differences between the reported amounts of assets and liabilities and their tax bases. Deferred tax assets are reduced by a valuation allowance when, in the opinion of management, it is more likely than not that some portion or all of the deferred tax assets will not be realized. Deferred tax assets and liabilities are adjusted for the effects of changes in tax laws and rates on the date of enactment.
Loss Per Common Share
Basic loss per share has been computed on the basis of the weighted-average number of common shares outstanding. Common shares issuable upon exercise of stock options and warrants (see Note 8) have not been included in the computation because their inclusion would have been antidilutive. Weighted average shares outstanding for basic and diluted loss per common share were 2,486,699 and 2,194,029 for the years ended December 31, 2003 and 2002, respectively.
Employee Stock Plans
The Company adopted a Stock Incentive Plan on June 24, 1997. The Plan provides for granting to employees, officers, directors, consultants and certain other nonemployees of the Company options to purchase shares of common stock. A maximum of 410,000 shares of common stock may be issued pursuant to the Plan. Of the maximum number of shares to be issued under the Plan, 270,000 have been reserved for incentive awards to be granted to the founders of the Company, and 61,000 are reserved for incentive awards to be granted to others.
28
Commonwealth Biotechnologies, Inc.
Summary of Significant Accounting Policies
(continued)
Employee Stock Plans (continued)
A 2002 Stock Incentive Plan was adopted by the Board of Directors and approved by the shareholders. The Plan makes up to 300,000 shares of common stock available for grants of restricted stock awards and stock options in the form of incentive stock options and non-qualified options to employees, directors and consultants of the Company.
Incentive awards may be in the form of stock options, restricted stock, incentive stock or tax offset rights. In the case of incentive stock options (within the meaning of Section 422 of the Internal Revenue Code of 1986, as amended), the exercise price will not be less than 100% of the fair market value of shares covered at the time of the grant, or 110% for incentive stock options granted to persons who own more than 10% of the Companys voting stock. Options granted under the Plans generally vest over a five-year period from the date of grant and are exercisable for ten years, except that the term may not exceed five years for incentive stock options granted to persons who own more than 10% of the Companys outstanding common stock.
The Company applies Accounting Principles Board Opinion No. 25 and related accounting interpretations in accounting for its plan and for management warrants and, accordingly, no compensation cost has been recognized. Had compensation cost for the Companys plan been determined based on the fair value at the grant dates for awards under the plan consistent with the method prescribed by FASB No. 123, Accounting for Stock-Based Compensation, the Companys net loss and loss per share would have increased to the proforma amounts indicated below:
|
2003 |
2002 |
|||||||
| Net loss |
||||||||
| As reported |
$ | (80,601 | ) | $ | (625,726 | ) | ||
| Proforma effect of recognizing stock-based compensation in accordance with FASB No. 123 |
(101,115 | ) | (132,644 | ) | ||||
| Proforma |
(181,716 | ) | (758,370 | ) | ||||
| Basic and diluted loss per common share |
||||||||
| As reported |
(0.03 | ) | (0.29 | ) | ||||
| Proforma |
(0.07 | ) | (0.35 | ) | ||||
Under FASB No. 123, the fair value of each management stock option and warrant is estimated on the date of grant using the Black-Scholes option pricing model. The following weighted-average assumptions were used for grants in 2003 and 2002, respectively: No dividend yield, expected volatility of 144% and 138%, risk-free interest rate of 4.38% and 1.2%, and expected lives of 10 years.
29
Commonwealth Biotechnologies, Inc.
Summary of Significant Accounting Policies
(continued)
Fair Value of Financial Instruments
The Company has determined, based on available market information and appropriate valuation methodologies, that the fair value of its financial instruments approximates carrying value. The carrying amounts of cash and cash equivalents, accounts receivable and accounts payable approximate fair value due to the short-term maturity of the instruments. The carrying amount of debt approximates fair value because the interest rates under the credit agreement are predominantly variable, based on current market conditions.
Reclassifications
Certain amounts in the 2002 financial statements have been reclassified to conform to the 2003 financial statement presentation. The reclassifications had no effect on either net income or retained earnings for the year ended December 31, 2002.
New Accounting Pronouncements
In October 2001, the FASB issued SFAS No. 144, Accounting for the Impairment or Disposal of Long-Lived Assets (SFAS 144). This statement addresses financial accounting and reporting for the impairment or disposal of long-lived assets. This statement supersedes FASB Statement No. 121, Accounting for the Impairment of Long-Lived Assets and for Long-Lived Assets to Be Disposed Of, and the accounting and reporting provisions of APB Opinion No. 30, Reporting the Results of Operations Reporting the Effects of Disposal of a Segment of a Business, and Extraordinary, Unusual and Infrequently Occurring Events and Transactions. This statement also amends ARB No. 51, Consolidated Financial Statements, to eliminate the exception to consolidation for a subsidiary for which control is likely to be temporary. This statement requires that one accounting model be used for long-lived assets to be disposed of by sale, whether previously held and used or newly acquired. This statement also broadens the presentation of discontinued operations to include more disposal transactions. SFAS 144 is effective for fiscal years beginning after December 15, 2001 and interim periods within those fiscal years. The adoption of SFAS 144 did not have an impact on the Companys financial position and results of operations.
In June 2002, the Financial Accounting Standards board issued Statement No. 146, Accounting for Costs Associated with Exit or Disposal Activities (SFAS 146). This Statement addresses financial accounting and reporting for costs associated with exit or disposal activities and nullifies Emerging Issues Task Force (EITF) Issue No. 94-3, Liability Recognition for Certain Employee Termination Benefits and Other Costs to Exit an Activity (including Certain Costs Incurred in a Restructuring). The principal difference between this Statement and Issue 94-3 relates to its requirements for recognition of a liability for a cost associated with an exit or disposal activity. This Statement requires that a liability for a cost associated with an exit or disposal activity be recognized when the liability is incurred. Under Issue 94-3, a liability for an exit cost as defined in Issue 94-3 was recognized at the date of an entitys commitment to an exit plan. A fundamental conclusion reached by the Board in this Statement is that an entitys commitment to a plan, by itself, does not create a present obligation to others that meets the definition of a liability. Therefore, this Statement eliminates the definition and requirements for recognition of exit costs in Issue 94-3. This Statement also establishes that fair value is the objective for initial measurement of the liability. The provisions of this Statement are effective for exit or disposal activities that are initiated after December 31, 2002. The adoption of SFAS 146 did not have a material impact on the Companys financial statement.
30
Commonwealth Biotechnologies, Inc.
Summary of Significant Accounting Policies
(continued)
New Accounting Pronouncements (continued)
In November 2002, the FASB issued Interpretation No. 45, Guarantors Accounting and Disclosure Requirements for Guarantees, Including Indirect Guarantees of Indebtedness to Others, an interpretation of FASB Statements No. 5, 57 and 107 and a rescission of FASB Interpretation No. 34. This Interpretation elaborates on the disclosures to be made by a guarantor in its interim and annual financial statements about its obligations under guarantees issued. The Interpretation also clarifies that a guarantor is required to recognize, at inception of a guarantee, a liability for the fair value of the obligation undertaken. The initial recognition and measurement provisions of the Interpretation are applicable to guarantees issued or modified after December 31, 2002 and are not expected to have a material effect on the Companys financial statements. The disclosure requirements are effective for financial statements of annual periods ending after December 15, 2002 and the adoption of No. 45 Interpretation does not have any impact on recognition of liabilities and any material impact on the disclosures.
In December 2002, the FASB issued SFAS No. 148, Accounting for Stock-Based Compensation Transition and Disclosure an amendment of FASB Statement No. 123. This Statement amends FASB Statement No. 123, Accounting for Stock-Based Compensation, to provide alternative methods of transition for a voluntary change to the fair value based method of accounting for stock-based employee compensation. In addition, this Statement amends the disclosure requirements of Statement 123 to require prominent disclosures in both annual and interim financial statements about the method of accounting for stock-based employee compensation and the effect of the method used on reported results. The Company does not expect the adoption of SFAS 148 to have an effect on the Companys financial statements.
In May 2003, the FASB issued SFAS No. 150, Accounting for Certain Financial Instruments with Characteristics of Both Liabilities and Equity (SFAS 150). This Statement establishes standards for how an issuer classifies and measures certain financial instruments with characteristics of both liabilities and equity. This Statement requires many instruments previously classified as equity to be classified as liabilities. Such as mandatorily redeemable shares and repurchase obligations related to an issuers equity shares. This Statement is effective for nonpublic entities for financial instruments entered into or modified after May 31, 2003 and otherwise is effective for fiscal periods beginning after December 15, 2004 for instruments that are mandatorily redeemable on fixed dates for amounts that are fixed or determinable. The Company does not expect the adoption of SFAS 150 to have a material impact on the financial statements.
In December 2003, the FASB issued a revised Interpretation No. 46, Consolidation of Variable Interest Entities (VIE), which clarifies the application of ARB No. 51 and replaces Interpretation No. 46. This Interpretation addresses the consolidation by business enterprises of variable interest entities as defined in the Interpretation. A nonpublic enterprise shall apply this Interpretation to all entities that are subject to this Interpretation by the beginning of the first annual period beginning after December 15, 2004. The Interpretation requires certain disclosures in financial statements issued after December 31, 2003 if it is reasonably possible that the Company will consolidate or disclose information about variable interest entities when the Interpretation becomes effective. The Company does not believe that it has any VIE for consolidation.
31
Commonwealth Biotechnologies, Inc.
Notes to Financial Statements
1. Property and Equipment
Property and equipment consisted of the following:
| December 31, |
2003 |
2002 |
||||
| Land |
$ | 403,919 | $ | 403,919 | ||
| Building |
4,904,666 | 4,904,666 | ||||
| Laboratory equipment |
3,383,151 | 3,359,189 | ||||
| Furniture, fixtures and office and computer equipment |
423,796 | 398,074 | ||||
| 9,115,532 | 9,065,848 | |||||
| Less accumulated depreciation |
3,465,875 | 2,867,120 | ||||
| $ | 5,649,657 | $ | 6,198,728 | |||
Depreciation expense was $598,765 and $620,986 for the years ended December 31, 2003 and 2002, respectively.
2. Demand Notes Payable
At December 31, 2002, the Company had a demand note payable with a bank, bearing interest at the prime rate plus 1%. The note was paid in full in March 2003.
32
Commonwealth Biotechnologies, Inc.
Notes to Financial Statements
(continued)
3. Long-Term Debt
Long-term debt consist of:
| December 31, |
2003 |
2002 |
||||
| Industrial Revenue Development Bonds Series 1998A (5.2% - 7%), payable in monthly installments of interest only through March 15, 2000, annual installments of principal and interest from March 15, 2001 through March 15, 2023, secured by a first deed of trust on land and building. |
$ | 3,400,000 | $ | 3,495,000 | ||
| Industrial Revenue Development Bonds Series 1998B (8%), payable in monthly installments of interest only through March 15, 2023 and a final payment of $330,000 due March 15, 2023, secured by a second deed of trust on land and building. |
330,000 | 330,000 | ||||
| Capital lease obligation due in monthly installments of $8,502 to August 2003, discounted at a rate of 10.9% |
| 65,311 | ||||
| 3,730,000 | 3,890,311 | |||||
| Less current maturities |
100,000 | 160,311 | ||||
| $ | 3,630,000 | $ | 3,730,000 | |||
Scheduled maturities of long-term debt are as follows:
| 2004 |
$ | 100,000 | |
| 2005 |
105,000 | ||
| 2006 |
110,000 | ||
| 2007 |
115,000 | ||
| 2008 |
125,000 | ||
| Thereafter |
3,175,000 | ||
| $ | 3,730,000 | ||
The bond agreements require the Company to maintain debt service reserve funds, which are held by a trustee. Debt service reserve funds are included in the balance sheets as restricted cash.
33
Commonwealth Biotechnologies, Inc.
Notes to Financial Statements
(continued)
4. Leasing Commitments
The Company leases equipment under noncancelable operating leases. Total expense for the years ended December 31, 2003 and 2002 was $42,800 and $48,000, respectively. Future minimum rental commitments under operating leases as of December 31, 2003 are as follows:
| 2004 |
$ | 42,600 | |
| 2005 |
35,500 | ||
| 2006 |
10,900 | ||
| 2007 |
3,600 | ||
| $ | 92,600 | ||
5. Retirement Plan
The Company maintains a 401(k) Plan (the Plan) which covers substantially all employees. Under the Plan, employees may elect to defer a portion of their salary, up to the maximum allowed by law, and the Company can elect to match the contribution up to 1% of the employees salary. No Company contributions were made to the Plan in 2003 or 2002.
6. Major Customers
Revenues for the years ended December 31, 2003 and 2002 include revenues from two major customers of approximately $1,154,000 or 23% of total revenues and $1,125,000 or 25% of total revenues, respectively. Trade receivables due from these customers as of December 31, 2003 and 2002 were $365,000 and $135,000, respectively.
7. Income Taxes
The difference between expected income tax benefits and income tax benefits recorded in the financial statements is explained below:
| December 31, |
2003 |
2002 |
||||||
| Income taxes (benefit) computed at 34% statutory rate |
$ | (27,400 | ) | $ | (212,747 | ) | ||
| State income tax benefit, net |
(4,200 | ) | (22,600 | ) | ||||
| Change in valuation allowance |
26,200 | 272,951 | ||||||
| Other |
5,400 | (37,604 | ) | |||||
| $ | | $ | | |||||
34
Commonwealth Biotechnologies, Inc.
Notes to Financial Statements
(continued)
7. Income Taxes (continued)
The significant components of deferred income tax assets and liabilities as of December 31, 2003 consist of the following:
| December 31, |
2003 |
2002 |
||||
| Deferred tax assets |
||||||
| Net operating loss carryforward |
$ | 3,499,000 | $ | 3,519,026 | ||
| Research and development credit carryforward |
52,600 | 52,564 | ||||
| Deferred compensation |
50,600 | 52,000 | ||||
| Other |
40,600 | 93,331 | ||||
| 3,642,800 | 3,716,921 | |||||
| Deferred tax liabilities |
||||||
| Tax depreciation in excess of book depreciation |
359,300 | 407,250 | ||||
| Net deferred tax asset before valuation allowance |
3,283,500 | 3,309,671 | ||||
| Less valuation allowance |
3,283,500 | 3,309,671 | ||||
| $ | | $ | | |||
Operating loss carryforwards of approximately $9,176,000 may be used to offset future taxable income and expire in various years through 2023. The Company also has research and development credit carryforwards of approximately $53,000 that expire in various years through 2020.
35
Commonwealth Biotechnologies, Inc.
Notes to Financial Statements
(continued)
8. Stock Compensation
In addition to employee stock option awards, the Company has reserved an aggregate of 383,889 shares of common stock for issuance upon exercise. Management warrants (100,000), warrants issued in connection with the 2000 private placement (174,000), warrants issued in connection with the 2002 private placement (83,889) and the Retainer and Transaction Fee Warrants (200,000) (see Note 9). During 2003, the Company issued 70,704 shares of common stock in lieu of directors fees.
Stock option transactions are summarized as follows:
|
2003 |
Weighted Average Exercise Price |
2002 |
Weighted Average Exercise Price |
|||||||||
| Options and warrants outstanding, beginning of year |
1,266,817 | $ | 5.05 | 958,047 | $ | 6.49 | ||||||
| Granted |
51,700 | 3.02 | 336,821 | 0.97 | ||||||||
| Exercised |
(30,445 | ) | .90 | | | |||||||
| Expired |
(101,500 | ) | 6.50 | (28,051 | ) | 4.90 | ||||||
| Options and warrants outstanding, end of year |
1,186,572 | 5.03 | 1,266,817 | $ | 5.09 | |||||||
| Options and warrants exercisable, end of year |
979,322 | 4.76 | 813,565 | $ | 5.91 | |||||||
| Weighted-average fair value per option and warrants for options and warrants granted during the year |
$ | 1.96 | $ | 0.70 | ||||||||
The following table summarizes information about stock options and warrants outstanding at December 31, 2003:
|
Outstanding |
Exercisable |
|||||||||||
|
Exercise Prices Per Share |
Number Outstanding |
Weighted (Years) |
Weighted Average Exercise Per Share |
Number Exercisable |
Weighted Per Share |
|||||||
| $0.85 1.50 | 312,076 | 8 | $ | .98 | 309,426 | $ | .98 | |||||
| $2.42 5.25 | 369,777 | 7 | 3.91 | 343,277 | 3.95 | |||||||
| $5.50 7.00 | 225,363 | 3 | 6.36 | 48,613 | 5.90 | |||||||
| $7.50 9.00 | 21,300 | 6 | 7.61 | 19,950 | 7.59 | |||||||
| $9.25 10.00 | 257,356 | 4 | 9.89 | 257,356 | 9.89 | |||||||
| $19.00 20.00 | 700 | 6 | 20.00 | 700 | 20.00 | |||||||
| $0.85 20.00 | 1,186,572 | $ | 5.03 | 979,322 | $ | 4.76 | ||||||
36
Commonwealth Biotechnologies, Inc.
Notes to Financial Statements
(continued)
9. Engagement of Segerdahl and Company, Inc.
The Company had engaged Segerdahl and Company, Inc. (Segerdahl) an investment banking firm, to provide the Company with investment banking services. The agreement was signed on April 22, 2002 and was for a term of one year and was subsequently extended to October 1, 2003, at which time it was not renewed.
In connection with the agreement, the Company issued to Segerdahl a three year warrant, as amended, to purchase 100,000 shares of the Companys common stock at an exercise price of $0.90 per share (the Retainer Warrant). The warrants vested in 2002. The expense related to the warrants was not material.
In addition, as a transaction fee, the Company issued to Segerdahl a three year warrant, as amended, to purchase 100,000 shares of the Companys common stock at an exercise price of $0.90 per share (the Transaction Fee Warrant). The Transaction Fee Warrant will only vest in the event (i) the Company completes a Transaction as defined in the agreement, and (ii) the Companys common stock trades at a price per share at or above $2.90 per share for 10 of 20 consecutive trading days during the term of the engagement. The warrants had not vested as of December 31, 2003.
10. Private Placement Offering
On August 30, 2002, the Company completed a private placement of 335,555 shares of common stock at a purchase price of $.90 per share and warrants to purchase an additional 83,889 shares of common stock. Each warrant gives the holder the right to purchase one share of common stock at a price of $.90 per share for a period of 10 years. The warrants are callable at the option of the Company at a price of $.90 each. As of December 31, 2003 and 2002, no warrants have been exercised. Proceeds, net of issuance costs, totaled $247,544.
37
Corporate Information
| Corporate Office |
||
| Commonwealth Biotechnologies, Inc. |
Patent Counsel |
|
| 601 Biotech Drive |
Burns Doan Swecker and Mathis, LLP |
|
| Richmond, VA 23235 |
1737 King Street |
|
| Telephone: 800-735-9224; 804-648-3820 |
Alexandria, VA 22314 |
|
| Fax: 804-648-2641 |
||
| E-mail: info@cbi-biotech.com |
Transfer Agent and Registrar |
|
| Web site: www.cbi-biotech.com |
Computershare Trust Co. |
|
| 350 Indiana St. |
||
| Golden, CO 80401 |
||
| General Counsel |
||
| Kaufman and Canoles, PC |
Independent Auditors |
|
| 1051 E. Cary St |
BDO Seidman, LLP |
|
| 3 James Center |
300 Arboretum Place |
|
| Richmond, VA 23219 |
Suite 520 |
|
| Richmond, VA 23236 |
||
Executive Officers and Board of Directors
| Executive Officers |
||
| Richard J. Freer, Ph.D. |
Robert B. Harris, Ph.D. |
|
| Chairman of the Board, COO |
President, CEO |
|
| Thomas R. Reynolds |
James H. Brennan, MBA |
|
| Executive Vice President and Secretary |
Controller |
|
| Directors |
||
| Richard J. Freer, Ph.D. |
Robert B. Harris, Ph.D. |
|
| Chairman of the Board, COO |
President, CEO |
|
| Thomas R. Reynolds |
Samuel P. Sears, Jr. |
|
| Executive Vice President and Secretary |
Attorney at Law |
|
| James Causey |
Donald A. McAfee, Ph.D. |
|
| Consultant |
Chief Technical Officer |
|
| Aderis Pharmaceuticals, Inc. |
||
| Peter Einselen |
||
| Broker |
||
| Anderson and Strudwick, Inc. |
||
38